Business Objects 4.0 - Platform Monitoring
BI Platform Monitoring in Business Objects Enterprise XI 4.0
Monitoring Benefits
- Understand System Helth
- Identifying Anomalies
- Supporting Maintenance
- System Failure Prevention
Monitoring in XI 3.X
- Monitor deployment using probes
- Probes provide the ability to monitor BO system using simulated application workflows which are run through SDK-based scripts
- Provided in a Monitoring Add-on package available for Material from Business Objects Labs
- Monitor using system and application tools
- Using enterprise CMC, Web server etc
Monitoring in BI 4.0
- Monitoring a brand new application in CM and is shipped with the platform
- Provides Dashboard showing Bird's view of SBOWE deployment
- Status of servers, alerts and KPIs
- Uses metrics exposed by different servers
- Maintains history and provides graphical visualazations
- Provides threshold notifications
- Default watches for all servers
- Intergration with SAP Solution Manager and IBM Tivoli
Main Pillars of Monitoring
- Metrics – Related measure like cpu usage RAM usage etcs
- Probes – To check availability of SBOE services by simulating workflows
- Watch – Provides real time status and historical trends of servers and workflows
- Alert – Notifications generated when user defined threshold value is reached
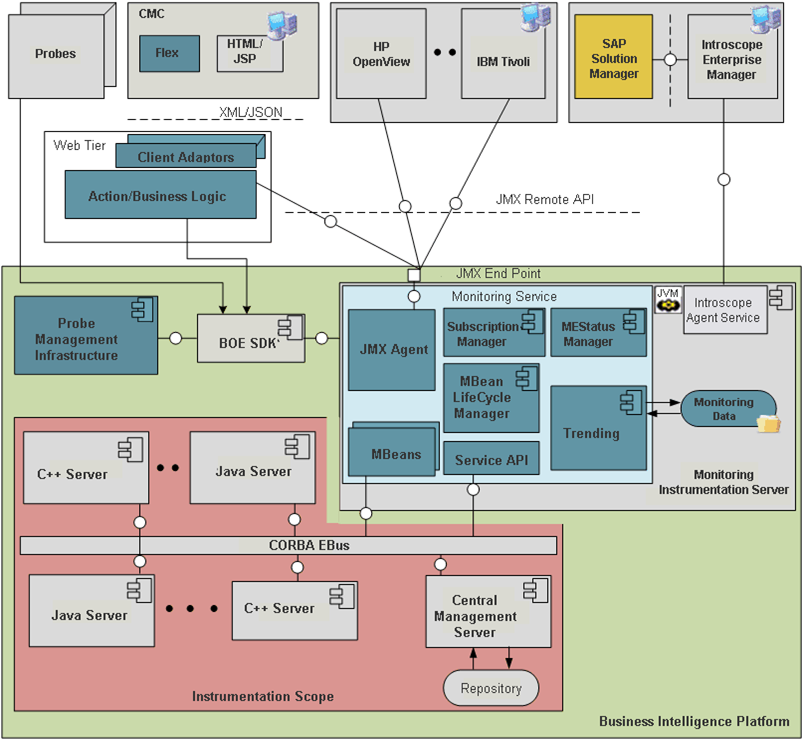
Monitoring Application in BOBJ 4.0 is based on JMX technology
Metrics
- Each server exposes its own metrics
- Owned by Domain teams
- System level metrics
- CPU, threads, memory
- Application level metrics
- Number of sessions, completed jobs etc
- Derived Metrics – Create by administrators by defining formulas
- Metrics can be consumed by other tools via JMX like IBM Tivoli tool
- Computed with in SBOW by watches
- "real time" graphical view of any metric
- Search / filer from toolbox
Probes
- Extension of probes concept in XI 3
- Typically a probe returns a Boolean result and a roundtrip time which can be monitored using a watch
- Probes can be run manually or schedules
- Intergrated in CMC and accessed from Monitoring Application, some probes will be shipped default
- Command line access
Watches
- Provide real-time status and historical trends of servers and workflows
- Two types
- System watch
- User Created watch
- Watch is a traffic light with either with two or three status (OK, Caution, Danger)
- Some watches are shipped with Monitoring Application
Monitoring Application is integrated with CMC
- Server status is determined by it's associate watch
- Clicking Server health icon to show watch details
- New column 'Health' in CMC server's list to show the status of each server
Third Parties Integration
- Integration with IBM Tivoli via Tivoli Enterprise monitoring Agent
- Integration with SAP solution Manager
- Open JMX framework allows simple integration
Roadmap – Planned in 4.1
- Graphical and tabular view with health status of each server
- Problem Drill Down and Root Cause using "follow the red"
- Facility to add own scripts for moniring
- Facility to create and select custom KPIs
- Summary of recent problem
- Monitoring trending universe – Reports based on this universe
- Template monitoring reports
Alerts notifications via email can be sent
Also Read:

